Our Footprints, Our Future
Our Footprints, Our Future
This plan was designed for the Our Footprints, Our Future project
Teacher Goals
Student Goals
- Create visual analysis of data
Assessment Standard in the Curriculum
- Organise, record and summarise information in appropriate electronic formats.
Curriculum Standards
Common Core State Standards
Math-Building Functions: Build a function that models a relationship between two quantities
Math- Number and Quantity: Represent and model with vector quantities.
Math-Modeling
Math Statistics and Probability: Make inferences and justify conclusion from sample surveys, experiments and observational studies
Math Statistics and Probability: Understand independence and conditional probability and them to intrepret data
Reading 7: Integrate and evaluate content presented in diverse media and formats, including visually and quantitatively, as well as in words.
Writing 4: Produce clear and coherent writing in which the development, organization, and style are appropriate to task, purpose, and audience.
Writing 7: Conduct short as well as more sustained research projects based on focused questions, demonstrating understanding of the subject under investigation
Writing 8: Gather relevant information from multiple print and digital sources, assess the credibility and accuracy of each source, and integrate the information while avoiding plagiarism.
Speaking and Listening 4: Present information, findings, and supporting evidence such that listeners can follow the line of reasoning and the organization, development, and style are appropriate to task, purpose, and audience.
Speaking and Listening 5: Make strategic use of digital media and visual displays of data to express information and enhance understanding of presentations.
Timetable
Week 1
- Introduce learners to the concept of Carbon Footprint
- Introduce learners to forum discussions.
Week 2
- Create an introduction of our class to the other via picture or video.
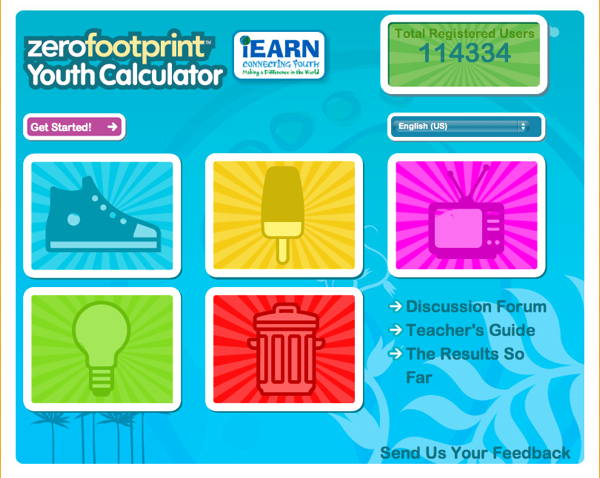
- Introduce learners to the Youth Carbon Footprint Calculator
Week 3
- Learners will start gathering data to be captured onto a spreadsheet
- Graphs will be introduced and learners will create a graph out of their data
Week 4
- Learners will analyse their data and make conclusions/recommendations
- Learners will present the findings/recommendations to other participants in the project around the world.
Specific Lessons
- Show learners a video/article about the effects that we bring about in our day to day lives to the carbon emissions into the atmosphere. Then show learners the introductory videos about iEARN. Then guide them to articulate their role in this project, which would be to recommend changes that we could make to our daily routine.
- The data that comes in will lend itself to the use of spreadsheets and graphs. And using powerpoint to express ones findings and recommendations.
- The interest will come from the interaction with foreign learners on the discussion forum. Also they will be looking at what other learners came up with. Possibly also engage learners in a discussion of what the earth may look like in 50 years time, listing all the change factors to consider.
- Learners will have to know a little about the carbon emissions and ts effect on the planet. They will also have to have some basic skills with the use of spreadsheets and presentation software.